


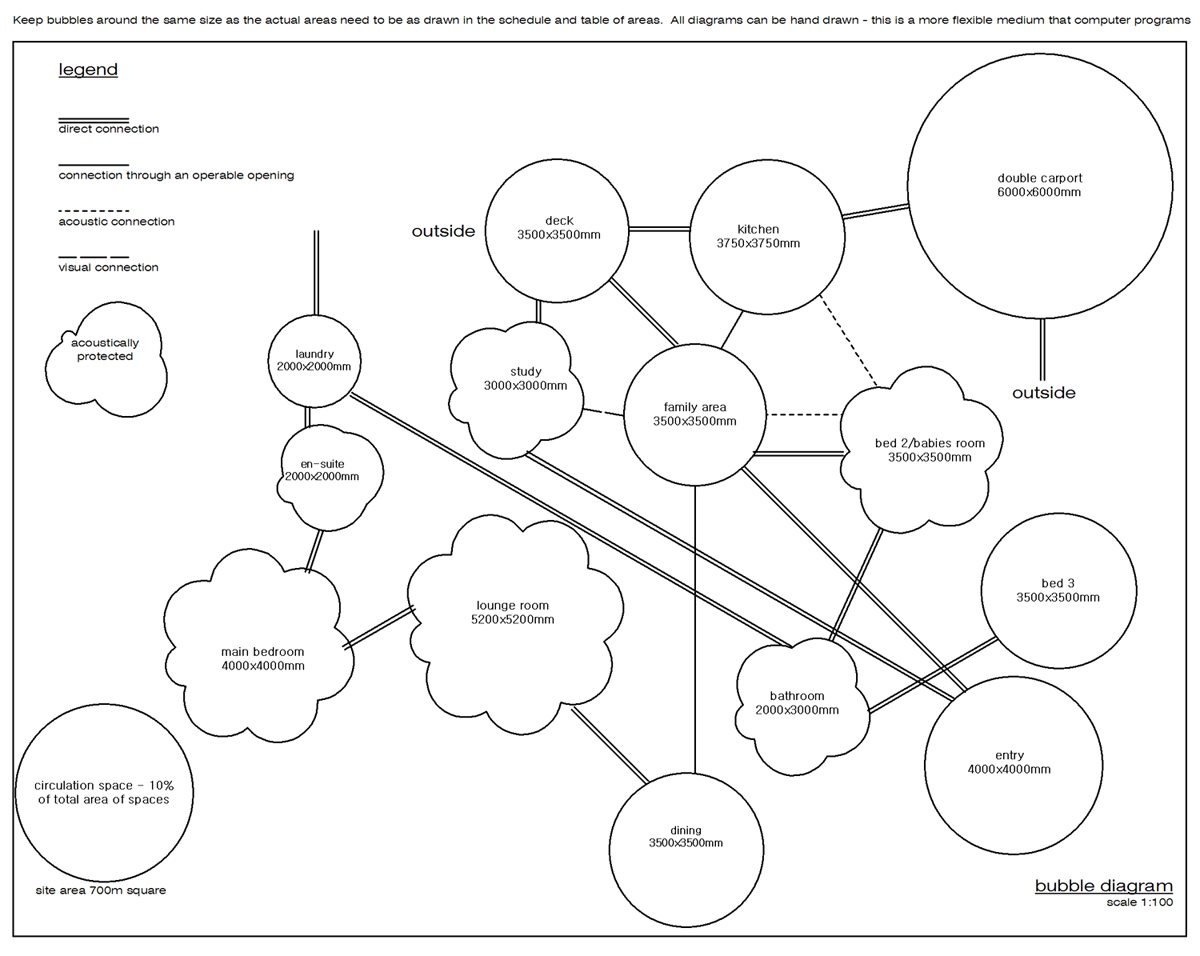
The Performance Specification has outlined what each space must provide, and the Schedule and Table of Areas will state the size of these areas, but you will also need to establish the relationships of these spaces to one another in detail. The "Relationship Diagram" or "Bubble Diagram" is a very simple drawing that consists of roughly drawn bubbles (representing spaces) connected by solid lines, broken lines or wavy lines etc to specify the type of relationship between the spaces.
For example: A lounge area may need a direct physical connection to the dining room but only a visual connection to the view of the ocean and an acoustic connection to the baby's room down the hall.
Example bubble diagram
Note: You can keep the bubbles around the same size because the actual areas are indicated in the schedule and table of areas.
Move your cursor over the table of areas below to magnify it.
Related articles (9 steps of home design)
DIY Home Design (main page) |
Step 5. Bubble diagram (this page) |